Our goal at Hunter Rowe is to continue to provide outstanding service even after your closing. We feel it is important to contact you periodically throughout the year and update you about information that is significant to your home and neighborhood. One of the things we feel you should know about is the housing market and the activity in your neighborhood that affects your home value. Sending a periodic Quick CMA and Buyer information sheet of a property that recently changed status to our clients when a home changes status in your neighborhood is one way we at Hunter Rowe continue to educate our clients about the housing market.
Below we will point out where you can find what the new, current status of the property that most recently changed status in your neighborhood is.
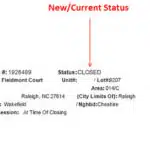
Where to find status from buyer information sheet example:
Quick CMA’s can be difficult to understand for some. It is a Comparative Market Analysis of homes similar to yours that have closed or changed status in the last 12 months. Below you will find explanations for what the CMA Summary is displaying, and what they mean:
1) Whenever any property in your neighborhood has CLOSED (SOLD), the CMA you receive from us will display categories as such:
 **Click on Image above to view full size
Moving from left to right categorically, starting with “#”:
“Num” = The number in the list of properties contained in the CMA
“MLS#” = Multiple listing number assigned by the Multiple Listing Service to the property
“PropDesc” = This is a field to indicate how the property is being described. Typically it will be in Square Feet or “SF”
“Address” = The physical street address of the property for this record
“SubArea” = This refers to the Sub-area of the properties listed in the CMA. It is primarily used as a geographic categorization code for all properties in the MLS.
This is more relevant when your property is not within a subdivision.
“SubDiv” = Subdivision in which your property and all properties in this CMA are located. This report will only display properties in your subdivision so that you can recognize what real estate activity is happening close to you. If your property is not in a subdivision it will simply say “Not in a Subdivision”. In this case, we use the “Sub-Area” described above to display what real estate activity is happening near you.
“Bedrooms” = Total number of bedrooms in this property
“TotalBaths”= Total number of bathrooms in this property, Full & Half included
“YearBuilt” = This is the year the property was built.
“LvngAreaSF” = This category displays the total living area square footage of the property.
“DOM” = Number of days property has been on the market
“LP” = Price that the property was last listed in MLS for before the property was sold
“$/LvngAreaSF” = List Price per total living area Square Foot
“SP”= This the price the property actually sold for. It is a much better indicator to the true value of that property than the List Price.
“$/LvngAreaSF” = Sales price per square foot. This figure is used by Agents and Buyers/Sellers alike to see the breakdown of the cost ofeach square foot in each property. In most cases, these figures are relatively similar for the properties displayed in the CMA.
*The CMA report will also display a minimum, maximum, average, and median figure for all the properties listed at the bottom of the table directly below the list of properties that appears as such:
![]()
This table will display the Minimum, Maximum, Average, and Median of all numerical figures found in the CMA to get a general idea of what is happening in the subdivision.
2) Whenever any property in your neighborhood has changed to PENDING or CONTINGENT, the CMA you receive from us will display categories as such:
![]()
**Click on Image above to view full size
For Pending or Contingent properties in the CMA Summary, the only difference in the fields displayed above is that you will not see a SP (Sales Price) or $/LvngAreaSF based on the Sales Price. However the $/LvngAreaSF will still be displayed based on List Price.
*For these properties we will also have Minimum, Maximum, Average, and Median figures displayed below the table as described above.
3) Whenever any property(ies) in your neighborhood have changed to ACTIVE, the CMA you receive from us will display categories as such:
 **Click on Image above to view full size
Here, there are no differences in categories from the other various Statuses (CLOSED, PENDING, CONTINGENT) displayed above. Please refer to definitions listed above for descriptions of categories for ACTIVE properties in your neighborhood.
*For these properties we will also have Minimum, Maximum, Average, and Median figures displayed below the table as described above.
5) There are three other statuses you may come across:
a) Expired-Listing agreements contain a pre-determined expiration date. When a listing agreement on a property expires, its status will be Expired.
b) Withdrawn-A “Withdrawn” status indicates that the seller and the listing agent have agreed to terminate the listing agreement prior to the completion of the term of the agreement.
c) Temp.Off Market-This status indicates a property that is currently unavailable for showings or open houses, though a listing agreement may still be in place.
We at Hunter Rowe hope that you have found this information helpful in determining what these reports mean to you. As always, if you have any questions please do not hesitate to contact us via phone or email!